Ocellaris Inspector
Ocellaris contains a custom postprocessor, the Ocellaris Inspector, which can plot time step reports from log and restart files. The inspector can also show the input and log files inside each restart file and has a number of more specialized plotting functionality for 2D iso-lines and quasi-static analyses.
More advanced 2D and all 3D visualization is delegated to tools like Paraview, but for plotting the Courant number or total energy as a function of time step for a finished simulation (log/restart file) or running simulation (log file) the inspector can be quite handy. Using Control+R to reload the results gives near instant monitoring of a running Ocellaris simulation.
Contents
Getting started
To run the Inspector you need to have a working installation of wxPython version 4.0 or later (tested with 4.0.0 beta 2). When this is installed you can start the Ocellaris Inspector by running:
python3 -m ocellaris_post.inspector myfile.log otherfile_endpoint_001.h5
This should show plots comparing the selected simulations.
WxPython is not installed in Docker and Singularity containers for size
reasons, but the whole ocellaris_post Python package is written to not
depend on FEniCS or Ocellaris, so you can quite easily run it in a more
“standard” Python environment. The Ocellaris inspector currently supports
both Python 2 and Python 3 so you only need to install wxPython, numpy, h5py,
PyYAML and matplotlib in your favourite Python install (or venv) to use the
Ocellaris Inspector. Most of these are probably installed allready in a
standard scientific Python installation.
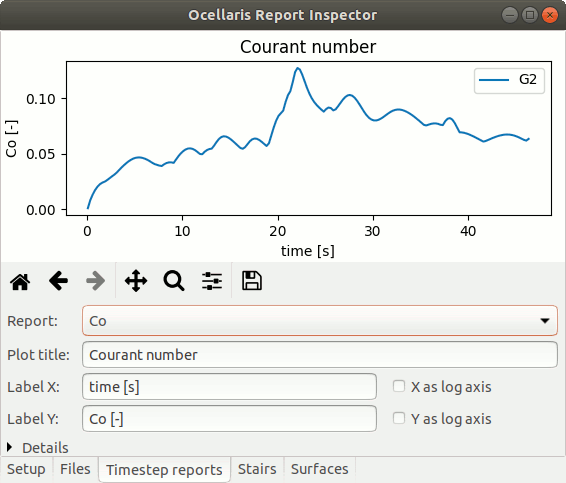
The Ocellaris Inspector showing the Courant number of a running simulation
Opening files
You can specify files on the command line, click the “Open” button in the “Setup” tab, drag and drop files into the program or use Control+O to bring up a file opening dialog.
You can also load log files from simulations running on a HPC cluster system by clicking the “Open running simulation” button in the “Setup” tab and giving the host name and mount directories for the HPC cluster login node. You must have enabled password-less SSH login to the head node, otherwise the cluster connector will not work
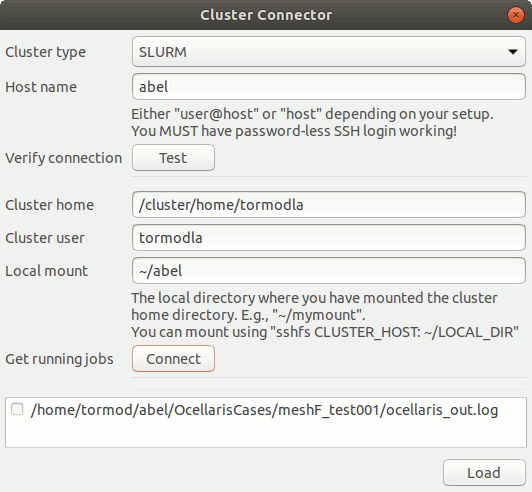
The cluster connection GUI
You must also have mounted the cluster home directory somewhere on the local
machine; via sshfs or other means. When the connection is established you
can select which simulations you would like to open and press the “Load” button.
Only SLURM clusters are currently supported, but just a tiny bit of glue code is necessary to implement support for other queue systems; please submit a patch or get in touch if you need such support. Loading running simulations from the current machine should also be easy and may be implemented in the future.
Scripting
For publication quality plots it is probaly best to use the ocellaris_post
package from your own Python scripts instead of using Ocellaris Inspector.
Script examples can be found in the scripts/ directory, though some of
these predate the ocellaris_post package. All results that are plotted in
the Inspector can be recreated by use of the ocellaris_post.Results
class. Open using the ocellaris_post.open_results() function:
-
ocellaris_post.open_results(file_or_dir, derived=True, inner_iterations=True) → ocellaris_post.results.Results¶ Give a file or directory name and get back a Results object. File names must point to an Ocellaris log file or an Ocellaris restart file. Directory names can be given for directories that contain only one log or restart file.
If derived is True then derived data, such as the timestep dt and the total energy Et will be included. Otherwise only data explicityly written to an output file will be included.
If inner_iterations is True then data from sub-timestep iterations will also be included, otherwise only data at the end of the time step is included.
-
ocellaris_post.read_yaml_input_file(file_name=None, yaml_string=None, error_func=None)¶ Read the input to an Ocellaris simulation from a YAML formated input file or a YAML formated string. The user will get an error if the input is malformed
This reader is less advanced than what is used inside Ocellaris, but it does not depend on FEniCS or any heavy libraries, so it is more lightweight. For full compatibility the
ocellaris.Simulation().input.read_yaml(...)method should be used.
-
class
ocellaris_post.Results(file_name, derived=True, inner_iterations=True)¶ Bases:
objectRepresents the results from an Ocellaris simulation
This is supposed to work as a back end for post processing use cases that are not covered by Paraview and similar programs and is hence intended for lighter data such as time step reports etc
The file name given can be either a simulation log file (for ongoing simulations) or an Ocellaris restart file
-
reports¶ A dictionary of report time series, the same as can be plotted in Ocellaris Inspector (Courant number, total mass, energy etc). Corresponding x-axis data can be found in
reports_x.
-
reports_x¶ A dictionary of report time series x-axis data vectors. Same length as the corresonding entry in
reports.
-
input¶ A plain dictionary conversion of the Ocellaris input file as returned by PyYAML.
-
get_file_path(name, check=True)¶ Try to get the path of an output file based on the information in the input file and the location of the restart/log file
-
reload(file_name=None, derived=True, inner_iterations=True, include_auxiliary_reports=True)
-